
A Picture of Frustrated Hopes
Posted: December 14, 2016 Filed under: Measurement and Analytics | Tags: American Dream, business strategy, Gini index, Income inequality, Rise of the Robots Leave a commentOne of the big global issues we face is the growing frustration of people as they see the lack of opportunity to better themselves even as they are better educated (often at the cost of crushing debt). This not an issue in North America or Western Europe, but also in the Middle East and in places in Asia such as Japan. Previous posts looked at the Gini Index as a measure of inequality, the Rise of Cybernation and the film Requiem for the American Dream.
A new study by a team of economists led by Raj Chetty of Stanford and Nathaniel Hendren of Harvard received access to millions of U.S. tax records that stretches over decades. The records are anonymous and came with strict privacy rules, but nonetheless allowed the team to, among other things, examine whether the “American Dream” of the opportunity for upward mobility was alive and well or under pressure. The result is a set of analyses that shows that upward mobility has dramatically declined.
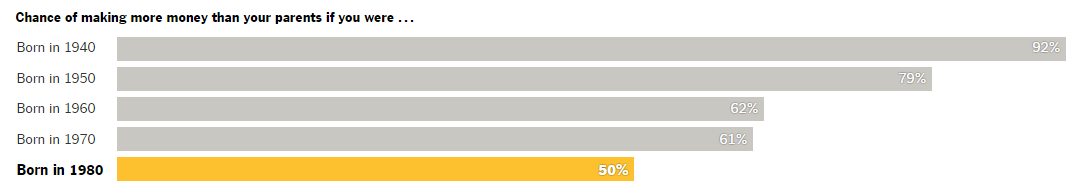
The bottom line is that if you were born in 1940, you had a 92% chance of earning more than your parents. By 1950, that had declined to a still-respectable 79%. By 1960 and 1970 the percentages were down to 62% and 61% respectively. But for those born in 1980 it has dropped to 50%.

Their analysis is very detailed. They looked at the income level of the parents and in 1940 the odds of out-earning your parents remained high even if you came from a wealthy family (as indicated by the high income percentile rank of the parent’s income on the horizontal axis).

For children born into modest households, for example families in the lowest 20% of incomes, one would hope that the children would have a good chance of improving their economic lot in life, but by 1980 only 55% of children from families at the 20th percentile did better than their parents economically whereas in 1960 it was 70% and in 1940 it was 94%.
Their data is granular down to 741 U.S. Census areas. In the slide below they indicate the areas with low (red) relative chances of economically advancing.

In his coverage of the report, New York Times reporter David Leonhardt writes:
The index is deeply alarming. It’s a portrait of an economy that disappoints a huge number of people who have heard that they live in a country where life gets better, only to experience something quite different.
Their frustration helps explain not only this year’s disturbing presidential campaign but also Americans’ growing distrust of nearly every major societal institution, including the federal government, corporate America, labor unions, the news media and organized religion.
In the 1980s, economic inequality began to rise, a result of globalization, technological change, government policies favoring the well-off and a slowdown in educational attainment and the work force’s skill level. Together, these forces pinched the incomes of the middle class and the poor. The tech boom of the 1990s helped — slowing the decline of the American dream — but only temporarily.
For babies born in 1980 — today’s 36-year-olds — the index of the American dream has fallen to 50 percent: Only half of them make as much money as their parents did. In the industrial Midwestern states that effectively elected Donald Trump, the share was once higher than the national average. Now, it is a few percentage points lower. There, going backward is the norm.
Psychology research has shown that people’s happiness is heavily influenced by their relative station in life. And it’s hard to imagine a more salient comparison than to a person’s own parents, particularly at this time of year, when families gather for rituals that have been repeated for decades. “You’re going home for the holidays and you compare your standard of living to your parents,” Grusky, a sociologist, says. “It’s one of the few ties you have over the course of your entire life. Friends come and go. Parents are a constant.”
The researchers have also constructed a model using the data that lets them see the effect of growing the economy on improving the curves as compared to reducing inequality such as eliminating the tax cuts in the 1980s that favored the wealthy.

While growing the economy faster (2.5% annually from 1980 to 2010 vs. the actual rate of 1.5%) moves the 1980 line up to an average of 61.9%, more broadly sharing the economic benefits among the low income and middle class raises the 1980 average of 50% to 79.6% even with the lower actual rate of 1.5% GDP growth per annum.
In discussions with business people there is much discussion about disruptive and transformative technologies such as “blockchain” and “learning machines.” While these are important things to track and understand I would argue they pale in comparison to the strategic issue presented by these charts.
Entire nations and generations of people are affected by the trends these charts illustrate. This is not simply a matter of social policy but also an urgent business issue as well. How well will your organization function if the society around it is in turmoil? How many business strategies rest upon the unstated assumption that a peaceful and stable society exists?
The research team has made public their data and analyses; it is well-worth examining.
