
Benford Strikes Again
Posted: May 10, 2013 Filed under: Measurement and Analytics | Tags: Benford's Law, collusion Leave a commentAn example of Benford’s Law in action from the December 15 2012 edition of The Economist:
These are nervy times for price-fixers. Banks that allegedly manipulated LIBOR, an interbank interest rate, are awaiting their punishment. At $800 trillion, the market is the largest ever to have been rigged. Fines to follow that imposed on Barclays in the summer are expected soon for other rate-fixing banks; this week saw the first arrests connected with the LIBOR scandal. Other cartels also have reason to be jumpy. The LIBOR case provides a good example of how competition authorities can use price data to scan markets, quickly spotting even small-scale collusion.
One way to identify dodgy prices is to use a splendidly counter-intuitive phenomenon known as Benford’s law. In a 1938 paper Frank Benford, a physicist working for General Electric, pointed out a pattern that occurs in large data sets. Across thousands of metrics, including 3,259 different population distributions and 741 sources of data on firms’ costs, he found that leading digits (for example, the numbers “3” and “7” in 3,259 and 741, respectively) are not distributed evenly, as you might expect. They follow a pattern: “1” is the most common and “9” the rarest.
For an example of why this should be, take an imaginary country with a population that doubles every year, starting at 1m people. After a year with “1” as the leading digit, it hits 2m and the leading digit changes to “2”. Fast forward another year and the population is 4m. But this means the leading digits “2” and “3” have both passed by in less than a year, occurring for fewer days than “1”. The pattern continues, with digits “4” to “9” spending progressively less time in the lead position. After a little over three years the country’s population is 10m, so that “1” is the leading digit again, where it stays for another year. And so on.
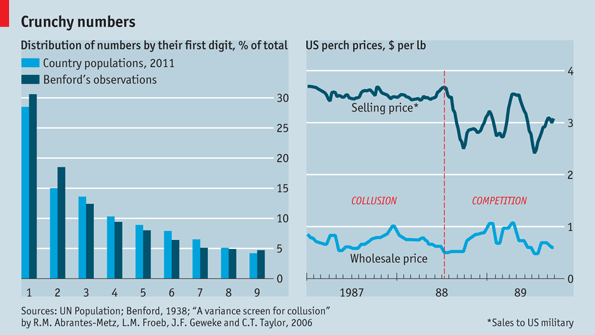
Benford’s law holds across a wide range of measures, including naturally occurring data like populations (see left-hand chart) and economic data like stockmarket returns. Such patterns can be used to test economic data: if numbers have been manipulated to give the appearance of randomness, the distribution of the digits will almost certainly violate Benford’s predictions. Forensic accountants have used the technique since the 1970s; a 2011 article showed that Greek economic data strayed further from Benford distributions than those of any other euro-area country.
The test also works for LIBOR. In a 2011 paper Rosa Abrantes-Metz of New York University’s Stern School of Business and Sofia Villas-Boas and George Judge of the University of California, Berkeley, examined LIBOR data over rolling six-month windows, and found that LIBOR was far likelier than another benchmark interest rate to depart from Benford patterns. A quick Benford test would have pointed to LIBOR anomalies long before one of the colluding banks chose to own up.
Applying Benford’s law is an example of a “price screen”, a quick test that can help spot markets where pricing patterns are odd and warrant further investigation. Although competition authorities would ideally use detailed information on companies’ prices and costs to identify collusion, since the ability to price far above cost is one measure of market power, information on firms’ costs is hard to come by. Hence the value of tests that can be run quickly, across various markets, using just the data at hand.
Take the pattern of prices over time. In a competitive market, theory suggests prices are set close to firms’ costs and track those costs over time. Because costs differ between firms, prices should as well. And since the prices of inputs are volatile over time, firms’ selling prices should vary over time, too. Cartels change things. Prices rise far above costs, so small cost increases can simply be absorbed. Once prices are being set collusively, a cartel may not want to raise them further for fear of being caught. And even if a single cartel member does want to change prices, agreeing this with all the others is time-consuming. Colluders don’t just raise prices; they tend to smooth them, too.
In a 2006 paper Ms Abrantes-Metz, Luke Froeb of Vanderbilt University, John Geweke of the University of Iowa and Christopher Taylor of the Federal Trade Commission used the price of fish sold to American military bases in the late 1980s to backtest the theory. A cartel had stitched up the market for cod, flounder, haddock and perch. When the cartel reigned, the prices of perch were oddly stable. But when providers began to compete, prices dropped by 16% and also became choppier, reflecting fluctuations in wholesale fish prices (see right-hand chart). A new paper on a generic-medicines cartel in Mexico found something similar.
All this suggests that one way to direct scarce antitrust resources is to set up automatic scans of market prices, looking for excess price stability. Watchdogs are already moving in this direction. In Italy a screen applied to pharmacies spotted a problem with baby-food prices. In America bids for stimulus-funded projects are checked for signs of collusion. But like any statistical test, scans for prices that are too stable can give “false positives”, implicating firms whose prices are flat for innocent reasons.
The use of mapping data can refine these tests. In a 2012 paper Pim Heijnen and Marco Haan, both of Groningen University, and Adriaan Soetevent of Amsterdam University analysed location and price data for around 3,300 Dutch petrol stations. Their first step was to calculate the distribution of petrol prices and label the most stable as suspicious. The next step was to use location data and maps. If the cause of smooth prices was something innocent (lazy managers, say) then suspect stations should have been randomly scattered across the country. But they weren’t. Stable pricing patterns often appeared in clusters, suggesting local collusion. Using data in this way promises much. The only problem is that as the watchdogs get better at knowing where to look, cartels are bound to improve at disguising their activities.
